Chromperfect Method File Editor overview
- Chromperfect

- Feb 6
- 7 min read
The Chromperfect Method File Editor is where you create and edit Method files with the MET extension. A Method file contains instructions for acquiring data, processing Raw files, generating plots, and producing printed or saved reports.
YouTube video explaining each tab in the method editor
Chromperfect Method File Editor - used in data acquisition
A Method file can be used for acquisition in two main ways. You can reference the Method file inside a Sequence file and download the Sequence to an instrument, or you can download the Method file directly to the instrument. In both cases, the resulting Raw files record the Method
file name and will normally use that Method when they are processed.
The Acquisition tab
The Acquisition tab contains settings used for data acquisition. These settings apply only when the method is downloaded to an instrument as the governing Channel A method.
Run Time sets the suggested run time for Raw files acquired under this method. The run time can be changed during acquisition, and the Raw file records both the suggested run time and the actual run time.
Data Samples per Second sets the acquisition sampling rate.
Acquire from Channel determines which channels are acquired when the method is downloaded to a multi-channel instrument.
Real-Time Plot Parameters affect only the real-time acquisition plot, not the plot included in the final report. Auto-Zero controls whether the real-time plot is auto-zeroed using a span value, or scaled manually using high-scale and low-scale values. The units used for these values are defined in the Units tab.
ICF Run Mode applies only to ICF instruments.
Reference Chromatogram File Name allows you to specify an optional reference Raw file. This file can be displayed alongside the real-time chromatogram, included in formatted reports, and can be opened automatically when another Raw or Bound file is opened in the Analysis program.
The Open button next to the file prompt opens the selected Raw file in a separate form.
Setpoint File options apply only when the method is downloaded to instruments connected to specific acquisition hardware. The Setpoint File frame allows an optional setpoint file to be specified for certain GC types. Depending on the selected instrument type, the setpoint file may be an MXT file, an M68 file, or an MTE file. The Open button next to the file prompt opens the setpoint file in a separate form.
Some ICF instruments also support a secondary pretreatment setpoint file with the MIP extension, used for headspace analyzers and similar equipment.
The Events tab
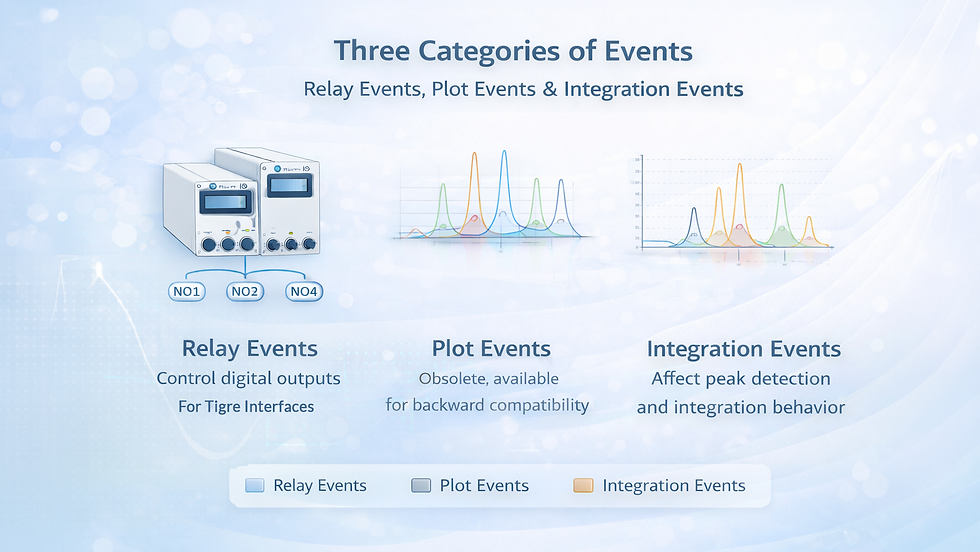
The Events tab contains the timed events used by the method. Events fall into three categories: relay events, plot events, and integration events.
Relay events historically controlled the state of digital outputs when using legacy acquisition hardware.
Plot events controlled plot appearance and are considered obsolete but remain available for backward compatibility.
Integration events are the largest group and influence peak detection and peak integration behaviour.
The list on the right shows available event types. The spreadsheet on the left shows the programmed events that will execute when the Method file is used. Each event includes a time, in minutes relative to the start of the run, and an event type.
To program a new event, insert a new row in the spreadsheet and enter the time and event code.
You can also double-click an entry in the list to place it into the selected spreadsheet row. Events can be entered in any order and are sorted by time when the Method file is saved.
The Processing tab
The Processing tab determines what happens when a Raw file or Bound file is processed automatically.
Chromatogram processing settings control whether the chromatogram is modified before integration. If multiple options are enabled, they are applied in a specific order. Depending on the method configuration, the chromatogram may be smoothed, have a baseline chromatogram subtracted, apply square-law compensation, or perform alignment.
Type of Smoothing selects the smoothing algorithm. If smoothing is enabled, Smoothing Time defines the smoothing window width.
Subtract Baseline Chromatogram enables baseline subtraction during processing. When enabled, the baseline Raw file name is specified using the file prompt control, and the Open button allows that Raw file to be opened in a separate form.
If the Method file contains anchors, Clear Anchors becomes available. Anchors are created in the Raw file editor and can be cleared here.
Initial Peak Detection Threshold defines how much noise the peak-detection algorithm will tolerate. If set too high, true peaks may be treated as noise and missed. If set too low, noise may be treated as peaks, creating false peaks.
Initial Peak Width defines the expected peak width used by the peak-detection algorithm. Chromperfect compares the sample rate from the Acquisition tab with the initial peak width and calculates the number of data points across a peak. By convention, at least ten points are recommended. If fewer than ten points are available at the current sample rate, the display indicates the minimum peak width that can be measured accurately.
Calibration File Name is optional. If supplied, the named Calibration file is used to identify components and calculate quantities. The Open button opens the specified Calibration file in a separate form.
File Options determine which files are produced during processing. These output files share the same base name as the Raw file, with different extensions. Depending on what you select, Chromperfect can produce ASCII area files, Excel area files, Bound data files, PNG plot files, XML data files, and AIA files.
Magnification increases the effective resolution of PNG plot files. Higher magnification increases file size.
Take Square Root applies square-root compression point by point during processing, which can help linearize detectors that exhibit square-law response.
Perform Alignment enables chromatogram alignment using the settings in the Alignment tab section.
The Report tab
The Report tab determines whether reports and plots are generated automatically during processing.
Number of Copies controls how many printed copies are produced.
Plots can be included in the printed output. Options include Chromatogram Plot, SEC MWD Plot, and SEC Calibration Plot. If more than one is selected, they are printed in the defined order.
If both a standard report and at least one plot are selected, Page Break After Plot controls whether plots and the standard report appear on the same page.
Report Text determines whether a standard report or plot is printed. Detailed File Information controls how much Raw file header information appears in the plot output.
Formatted Reports are specified using a list of Format files. These may contribute to printed output and may also generate ASCII file output. If multiple Format files produce ZED or PDF output, the reports can be concatenated into a single output file.
The Plot tab
The Plot tab controls the size and scale of printed chromatogram plots. These settings also control the initial scales used by plots displayed in the Analysis program.
Plot dimensions determine plot size and position, including plot height, number of panels, and width and placement if full-width output is not selected.
Time scaling controls the time axis. Auto Scale scales from zero to the run time. Manual Scale uses start and stop time values, with the unit defined in the Units tab.
Voltage scaling controls the response axis. Auto Scale automatically scales so the chromatogram does not run off the plot. Auto Zero uses a span value. Manual Scale uses high-scale and low-scale values, with units defined in the Units tab.
Additional auto-scale modes allow the plot to ignore early peaks, ignore tallest peaks, or impose a hard limit, which can prevent very large peaks from compressing the rest of the plot.
The Plot Options tab
The Plot Options tab determines how plots are drawn.
Force Black and White Printing forces plot colours to black to improve printer compatibility. This affects printed plots, not screen plots.
Orientation of Time Axis controls whether time is displayed along the bottom or along the left side.
Drawing options control features such as search windows, data point display, peak tick marks, baselines, grid lines, and filled peaks.
Label options control what text appears in the plot, including peak numbers, retention time labels, modified peak markers, timed event markers, axis labels and units, sample name, file name, and annotations. Component names can be shown in different locations, and peak quantities such as amount, area, or height can be displayed.
Label overlap behaviour affects readability. Allowing overlap can make labels difficult to read, while forcing labels apart can push labels off the top of the plot depending on the number of labels.
Segmented plot options control whether and how the plot is segmented into intervals, including whether segments are overlaid, whether all segments are labeled, and whether segment ranges are shown.
The User Programs tab
User programs allow Chromperfect to execute a user-specified program at different stages. Chromperfect supports download-time user programs, process-time user programs, and alarm-time user programs.
Download-time user programs run when a Method file is used to download an instrument.
Process-time user programs run during automatic processing of Raw or Bound files. Alarm-time user programs are configured in the Format file.
Each type of program receives specific command line arguments. There are also restrictions when using batch files, particularly around spaces in paths and file names, and quoting behaviour to ensure arguments are interpreted correctly.
The Units tab
The Units tab defines the time and response units used for plots. These units affect printed plots, plots shown on screen, and plot scale values stored in the Method file. They do not change the retention times, peak heights, or peak areas reported in outputs.
Time axis units can be minutes, seconds, or user-defined. Response axis units can be microvolts, millivolts, volts, or user-defined. If you use custom units, you must supply the unit name and conversion factors, and optionally a zero offset.
The SEC-related tabs
The SEC tab controls SEC-related settings.
Enable SEC updates changes how automatic calibration updates are applied. An optional SEC
Calibration file can be specified to direct SEC calculations, and SEC-related plot elements such as SEC baseline and various ranges can be displayed depending on the chosen settings.
The SEC Plot tab controls SEC MWD plots, including axis scaling, curve selection, legend options, and label options. At least one curve must always be selected.
The SEC Cal Plot tab controls SEC Calibration plots, including scaling and curve selection. Legend options can be enabled, and molecular weight may be displayed on a logarithmic scale on the right.
The Miscellaneous tab
The Miscellaneous tab contains Creator and Description fields. These are documentation fields.
They appear on the printout but have no other effect.
The Alignment tab
The Alignment tab supports the InfoMetrix LineUp chromatogram alignment utility integrated into Chromperfect. A LineUp license is required to use this feature. The Target Chromatogram is a Raw file used as the alignment reference.
The InStep tab
The InStep tab supports the InfoMetrix InStep multivariate predictor utility integrated into Chromperfect. An InStep license is required.
If Produce InStep Report is enabled, processing can generate an InStep report text file with the ISR extension, and its contents can be included in a formatted report.
Printing a Method file
To print a Method file, choose one of the Print options from the File menu.
A print form allows you to select which tab sections are included. Each checkbox corresponds to a tab page in the Method editor. Select the sections you want, press OK, and Chromperfect generates the printout.
Comments